Build a knowledge base about cycling
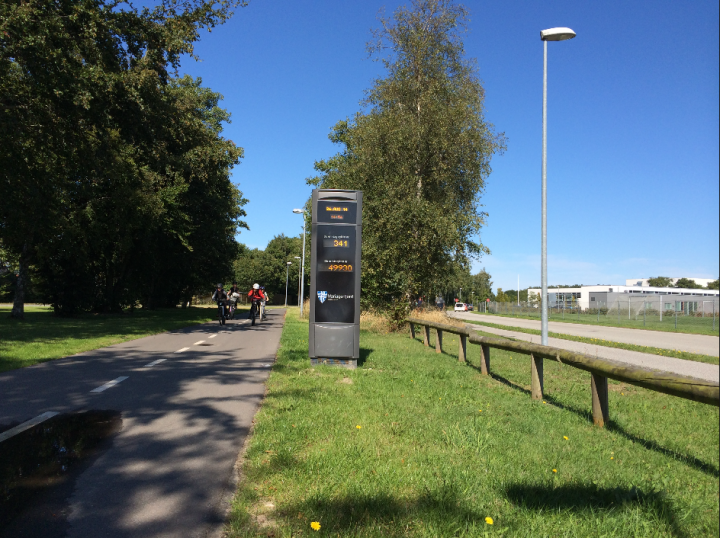 The bike barometer in Holstebro, Mariager Fjord municipality. The barometer is a continuous, easily understandable cyclist count display. Photo: Birgit KrohAlminde, Mariagerfjord municipality.
 You need a good database if you want to make the right decisions. This also applies to bicycle planning since a knowledge base containing different types of data solidifies the decision making process not only for bicycle planning, but for general urban and traffic planning as well.
Author: Maja Sig Vestergaard, Rambøll
Good data about bicycle traffic and cyclists is essential
Correct, updated data is an essential foundation for making the right decisions and achieving the municipal objectives and visons for cycling. Without proper data we’re operating in the dark, and we risk spending our resources in the wrong places.
If you wish to support and promote cycling in the city or the local authority area it is crucial to know what to focus on and subsequently to monitor progress to see whether the investments have had the desired effect. This applies to both the administrative and the political level.
As an administrator, when direct political approval is not required, it’s easier to make the right decisions if you have a solid database, for example the best way to launch a cycling campaign, or the most effective cycle track design. Furthermore, when political approval is required, you will be in a better position to advise politicians and recommend the best direction to go or the most appropriate solution,for example when it comes to prioritizing the coming year’s bicycle action plan budget.
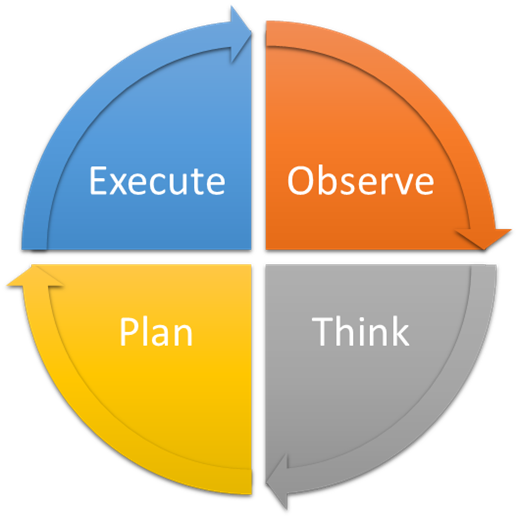
- The amount of collected data necessary for a given project varies. However, most projects require data collection during the observation phase, when you’re observing the situation and thinking about how to address it.
It’s difficult to improve cycling conditions significantly without the necessary resources. In order to ensure that resource allocation for cycling promotion continues to be a priority it’s essential to be able to measure whether investments and initiatives have had the desired effect. The collected data should be able to show the desired change in areas where cycling promotion measures have already been initiated. The value of robust assessment of what has been carried out and its value in relation to future prioritization should definitely not be underestimated.
What is the purpose of your data collection?
Before embarking on data collection you need to have a clear idea of what you want to find out. Consider:
- What questions do you want answered?
- How should the data subsequently be used and communicated?
- What resources are available for data collection – both time and money?
Only now can you decide on the most suitable method for collecting the data you need.
Bicycle planning can contribute to overall municipal aims, depending on the locality. It makes sense to consider whether and how bicycle traffic progress can be monitored so as to contribute to the fulfillment of these aims. Examples of general objectives:
- Better accessibility in cities
- Better urban environment with less pollution (CO2, NOx, noise)
- Increased mobility
- Reduced number of traffic accidents
- Increased citizen satisfaction
Different types of data
Different types of data provide different kinds of knowledge, which again can be put to different uses. Traditionally a distinction is made between quantitative and qualitative data.
Quantitative data
Quantitative data is data that answers questions like “where” or “how many”? Such data is not flexible, and makes it easy to monitor effects over a given period.
Quantitative data can be further subdivided into data that represents facts, i.e. it doesn’t delve into attitudes, etc.:
- Modal split (how many people choose which transport mode?) This can be further subdivided into:
- Total number of trips– trip distribution
- Short trips – where the bicycle is an obvious transport mode choice –trip length
- Purpose of the trip – work/education/school/ shopping/leisure activities
- Number of cyclists on selected roads and paths
- Bicycle parking (how many spaces, what type, and number of parked bicycles)
- Total length of cycle track network
- Number of accidents (what types and who is involved)
Other types of quantitative data delve into citizen attitudes to cycling and cycling conditions. Once again this is a question of counting: how many people have responded what, so even though the object measured is an attitude, the data is still quantitative. Here are some examples:
- How many citizens are “satisfied” or “very satisfied” with cycling conditions in the local area?
- How many citizens choose not to cycle, for example because they feel insecure in traffic?
- How many citizens “fully agree” or “partially agree” with the statement “cyclists should be prioritized at controlled intersections even if drivers need to wait a bit longer”?
- How many citizens are aware of a given cycling campaign?
It’s usually not possible or even desirable to ask all citizens in a given locality the questions listed above, but depending on the sample size, planners will be able to form a good idea of citizen satisfaction. It’s often a good idea to divide citizens into two groups: those who cycle at least once a week and those who cycle less.
Advantages and disadvantages of quantitative data
Advantages: Disadvantages: Relatively easy:
- To measure
- To calculate (for example, percentages)
- To communicate and understand
- To use to check on progress
Risk of error:
- Misinterpretation of data
- Poorly formulated survey questions
- The correct choice is not available among the possible responses
- Easy to make things look better than they really are
- Doesn’t contribute to a deeper understanding
Qualitative data
Qualitative data can help underpin understanding of what motivates people to choose their transport mode today, and what would motivate them to cycle. The advantage is that a better understanding can be reached through an interactive dialogue rather than when the only option is filling out a survey questionnaire.
This type of data can be useful in finding out precisely what should be done to make cycling more attractive, or how bicycle traffic should be branded so both citizens and the local authorities realize the benefits of cycling.
It should be borne in mind that citizens often speak of cycling in glowing terms, but may not actually do it as often as they say. The responses derived from qualitative data collection methods are longer and more often based on dialogue. Other factors play a role, such as personal reactions to the survey question and body language. Here is a fictive example of a dialogue- based response:
Question: Why don’t you think the bicycle is an attractive transport mode for your everyday transport?
Response: I don’t feel secure when I’m cycling.
Question: Why don’t you feel secure?
Response: I have to go through a dark tunnel.
Question: If there was more light in the tunnel, would that change anything for you?
Response: Yes, it might.
Advantages and disadvantages of qualitative data
Advantages: Disadvantages:
- Contributes to a better understanding
- Can provide useful input about what can motivate people to cycle
- Time consuming
- Small- group respondents = not necessarily representative
- Difficult to formulate and follow up over time
Both quantitative and qualitative data collection methods can contribute valuable perspectives on bicycle traffic and cycling conditions, and the ideal solution for achieving the optimal basis for bicycle planning is to use both methods.
Data collection methods
There are myriad ways to collect data, and it’s inadvisable to use them all. Planners should maintain focus on the data collection purpose, and perhaps how it may link up with the local authority’s overall aims.
Quantitative data collection methods
There’s no getting around quantitative data for analyzing and assessing the progress of bicycle traffic. Most local authorities working on promoting bicycle traffic will continuously monitor progress and results by cycle counts at the very least. The table below provides an overview of some of the most common topics that need to be clarified and the quantitative data collection methods that can be used.
| Topic | Method | Explanatory remarks | |
| Modal split | Survey | For example, via representative telephone interviews with the local authority’s citizens, citizen panels, or social media. It’s hard to make a good questionnaire and it’s recommended to test the questionnaire thoroughly in advance to avoid mistakes. | |
| TU data (The Danish National Travel Survey) | DTU’s (Technical University of Denmark) transport habit analysis is an annual telephone interview survey, the purpose of which is to map out the Danish population’s traffic behaviours. It includes all local authorities and it makes it possible to benchmark as well as measure modal split development over time. | ||
| Number of cyclists on selected roads and paths. (For further information see the Danish Road Directorate publication Cykeltrafiktællinger * (see below) | Pneumatic road tube sensors | Frequently used, cheap counting method that can be set up on short notice. Used in periodic, ad hoc counts. Uncertain results with intense bicycle traffic. Data can only be shown to be incorrect after the count is completed. Tests in the capital region of Denmark have shown that they measure approx. 80% of passing bicycles so it’s a good idea to choose the newestpneumatic tubes on the market. | |
| Coils and sensors in the road | Used for permanent counts since they’re embedded in the surface. Extremely reliable and low maintenance, but relatively expensive to install. Often used with bike barometers. | ||
| Manual counts | One or more persons manually register the number of passing cyclists. Carried out over a limited period of time, and is best for registering cyclist turning flows or the distribution between children and adults, for example when making school routes safer, use of bike helmets, etc. | ||
| Camera registration | A programmable camera is installed on a mast or a drone and software detects cyclists. This also provides insight into cyclist behaviours and turning flows, for example at an intersection. Investment in the equipment and the subsequent software analysis can be expensive. Be aware that the GDPR rules must be complied with. | ||
| Radar | Radar can also be used for bicycle counts. The method is less common. | ||
| Mobile phone (Bluetooth) | Many people cycle with Bluetooth on their phone turned on, which can be registered by a special traffic sensor. However the counts are less valid when it comes to counting the number of cyclists since not all cyclists cycle with
Bluetooth activated. |
||
| Cyclist behaviour,
Route choice, and speed |
Camera registration | A programmable camera is installed on a mast or a drone and software detects cyclists. This also provides insight into cyclist behaviours and turning flows, for example at an intersection. Investment in the equipment and the subsequent software analysis can be costly. Be aware that the GDPR rules must be complied with. | |
| Mobile phone (App) | If you can get cyclists in your area to download an app and allow you to follow their movements you can get an indication of where they ride and when. This also makes it possible to inform cyclists of the quickest route and create heat maps. | ||
| Mobile phone (Antenna localization) | The mobile network operators’ geo-localization can be used to collect continuous mobility data from users’ phones. The data is collected across transport modes and can be used, for example, in O/D analyses or effect measurements of changed access roads, mobility offers or urban development.
Mobility data precision and the distribution across different transport modes depend to a certain degree on local antenna conditions. Be aware that GDPR rules must be complied with.
|
||
| Tags attached to bikes (RFID) | Tags with long-life batteries are attached to bicycles. Each tag has a unique ID which can be recognized by a traffic sensor so as to form a picture of the route and travel speed. This also provides a basis for informing cyclists of the quickest route and creating heat maps. Tags should be of an acceptable size and design. Potential source of error:If the bicycle is transported on the back of a car. Expensive method, but provides good data. | ||
| Accident data | Accident data from vejman.dk | All accidents registered by the Danish police are available on vejman.dk. Most serious accidents and those involving motor vehicles will probably be there. However, a large number of cyclist accidents are not registered by the police (dark numbers). In other words, don’t expect vejman.dk to provide the full picture. Approximately 10% of cyclist accidents are registered by the police. | |
| Emergency room data | Certain emergency rooms systematically register traffic accidents. This data can be used to support vejman.dk data. | ||
| Self-reporting app | Accidents can be self- reported by aspecial phone app, as in Silkeborg municipality. For further information go to the Silkeborg website: https://silkeborg.dk/Borger/Veje-trafik-og-transport/Trafiksikkerhed/Uheldsregistrering] | ||
| Bicycle parking | Counts of the total number of bicycle parking spaces and occupancy rate | Manual counts. Good idea to combine this with a tidy up: cyclists need to remove a tag from their parked bicycle to show that the bicycle is in use and not abandoned. | |
| Cycling potential | Home-workplace data, Statistics Denmark | Based on a customized GIS zoning division it’s possible to draw out home-workplace data, for example to create an overview of how many people work in the same city/neighborhood where they live. | |
| Surveys | For example, telephone interviews with representative groups of citizens, citizen panels or social media. Developing an effective questionnaire can be difficult, and it’s recommended to test a questionnaire thoroughly before sending it out in order to avoid errors. | ||
There are myriad options for collecting quantitative data, each of which can contribute valuable knowledge depending on the issues that need to be addressed. However, if you haven’t clearly defined the basis for your data collection methods, you run the risk of drowning in superfluous data or finding yourself with a lot of useless, expensively acquired data. It is essential to maintain a clear focus on the questions you wish your data collection to answer.
Qualitative data collection methods
Qualitative data collection is an excellent supplementary method to arrive at a deeper understanding of what motivates cyclists and potential cyclists in your city or local authority area. Here are some examples:
Interviews
Interviews give you the opportunity to explore in greater depth areas that people consider important. Respondents are selected on the basis of issues that you wish to examine further. One way of going about it is to ask respondents in a survey whether they may be subsequently contacted for further commentary. You may thus already have basic knowledge about them including demographic factors.
Focus group interviews
This type of interview invites a group of citizens in to discuss general attitudes to cycling and cycling conditions in the city or local authority area. The interview can be structured to a greater or lesser degree. It can provide excellent results, but there is also a risk that one or a few individuals come to dominate the discussion so no one else gets a chance to give their input and express an opinion. It requires a strong facilitator.
Workshops
Workshops as part of or as an alternative to a traditional citizen’s meeting can also provide valuable input since they make it possible to ask in-depth questions and enter into a dialogue on a given issue.
Assess and share your knowledge about cycling
Assessment is important for knowing what works where – and why. The knowledge you’ve collected can prove useful when it comes to arguing for future solutions, priorities, and recommendations, in a dialogue with politicians, for example.
One type of assessment is a study of whether a given construction project has had an effect. Before- and- after bicycle counts and questionnaire surveys, for example, show whether the improved cycle track has got more people cycling, increased their sense of security, or switched more road users over to bicycles. For further information about the Cycle Superhighways assessment methods in the capital region of Denmark see http://asp.vejtid.dk/Artikler/2019/05x/9292.pdf.
A bicycle account is an excellent way to assess cycling initiatives and knowledge sharing results on a more general level, and is in common use among Danish local authorities. A bicycle account doesn’t merely register the number of additional cyclists on a given cycle track stretch or the number of cyclists that are satisfied with cycling conditions. It also assesses cycling progress in terms of social cost-benefit parameters as an integral part of the local authority’s overall aims and objectives, including:
- Urban environment in relation to noise, particle emissions, and NOx
- Saved amount of CO2
- Saved number of sick days and reduced health costs
- Reduced congestion
The City of Copenhagen has published bicycle accounts since 1996. See them here .
Assessment provides useful knowledge for everyone, and knowledge sharing is crucial in the field of cycling to avoid repeating other people’s mistakes. Negative stories in the media and among citizens about the local authority’s initiatives to promote cycling may have a negative impact on future prioritization, which is why it is essential to share your own knowledge and gain as much knowledge as possible from other people about what works and what doesn’t. Articles in professional publications and presentations in network contexts are excellent fora, as well as the Danish Road Directorate’s cycle seminar/cycle conference.


