Cost-benefit of cycling infrastructure
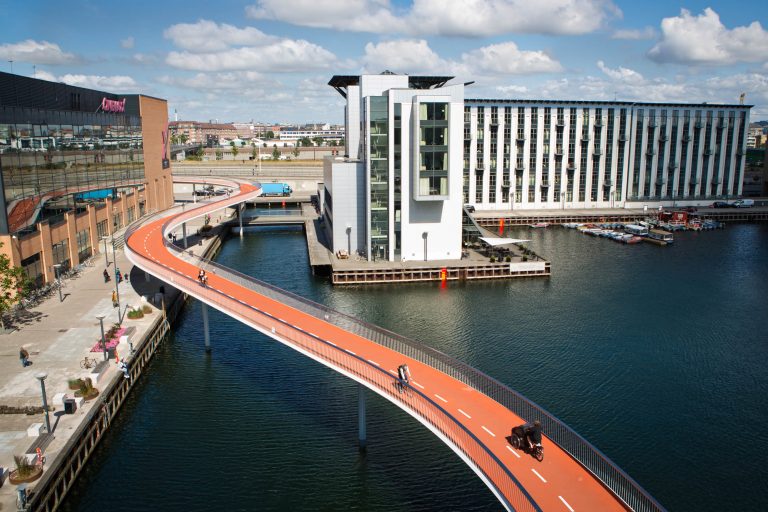
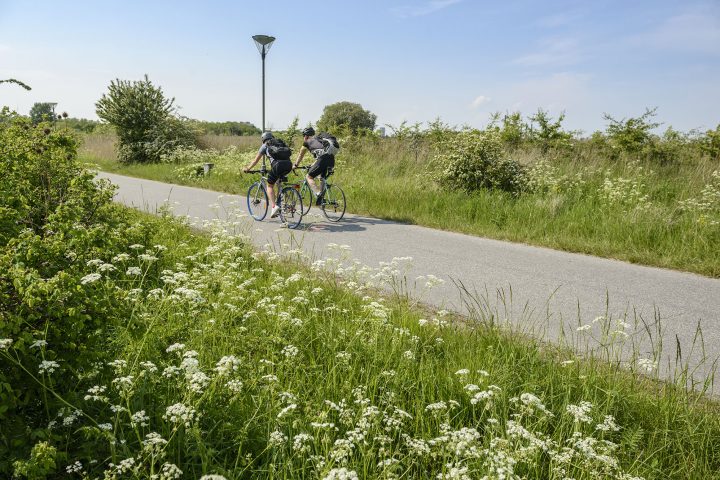 Picture of a cycle superhighway, inner ring route. Credit: Cycle Superhighways, Capital Region of Denmark
 Cycling infrastructure is an asset to society. The greatest gains are in the field of public health for example due to reduced sick leave. An economic analysis can calculate the specific costs and benefits of a given project and assess whether or not it’s a good investment.
By Anna Garrett, the Office for Cycle Superhighways
An economic analysis is a systematic, holistic method of analysing all known effects of a given project. Therefore, the economic analysis is a mandatory supplementary decision-making tool for all major infrastructure projects in Denmark financed by the State. The Ministry of Transport has drawn up a manual for the implementation of economic analysis in the transport area. The Ministry of Transport does the analysis itself when the Ministry is the sponsor of a large project, for example a highway construction project. An infrastructure project is profitable if the internal rate of return is greater than 4%.
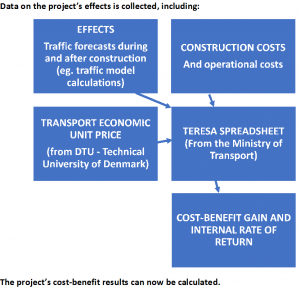
- Figure 1: A cost-benefit analysis is born:
Bicycles are included in the economics
In order to treat bicycle traffic on equal terms as other transport forms and to improve decision makers possibilities to prioritize the transport area its a prerequisite to have a solid planning foundation.
No value was assigned to cycle trips until 2009 so it was not possible to calculate the cost-benefit of cycling infrastructure and cycling measures before then. In 2009 this was done by COWI on the initiative of the City of Copenhagen, and since then the value of cycle trips along with other transport modes has been updated by DTU on an on-going basis.
Economic analysis of cycling infrastructure is limited. That’s primarily because it’s the not the State but the municipalities responsibility to establish cycling infrastructure and therefore economic analysis is not required. Although, economic analysis is particularly interesting in the area of cycling because they show that investing in cycling infrastructure is extremely profitable primarily due to the health benefit gains.
Transport economic unit prices
The economics unit costs consist of two parts: the effect on the individual road user and the effect that the individual’s choice of transport mode has on the rest of the society. In economic terms these are called internal and external costs. The internal costs include the cost of time, vehicle wear and tear, fuel (in the case of motor vehicles), and health. The external costs include expenses incurred by traffic accidents, hospitalization, environmental considerations, congestion, etc.
Cycling makes a society richer
Table 2 shows the unit price in DKK per kilometre travelled by bicycle, car and walking. The table shows that there is a relatively high time cost for the individual cyclist since cycling speed is lower than car speed. However, the personal health gain is almost as high as the corresponding time cost. There are also health gains among the external effects including saved medical costs and added value at work due to fewer sick days.
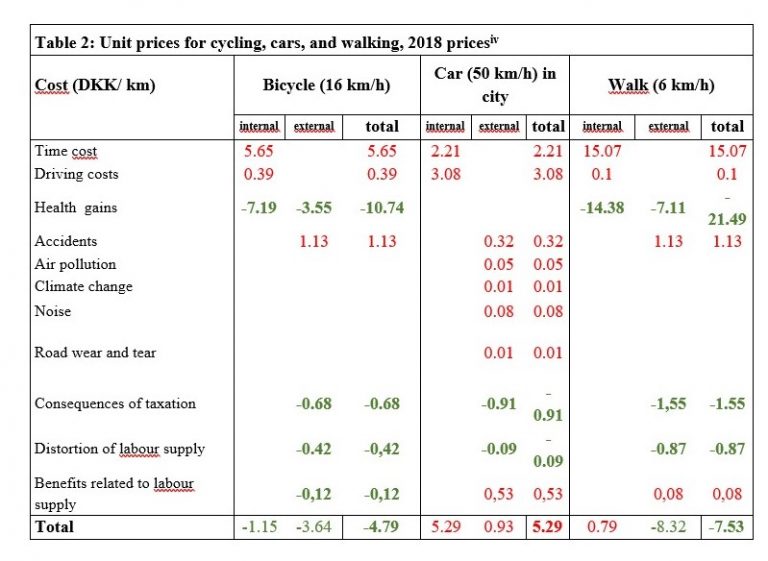
- When all factors are calculated, society gains DKK 4.79 per kilometer cycled, primarily due to the large health benefit, whereas it costs society DKK 5.29 for every kilometer driven by car.
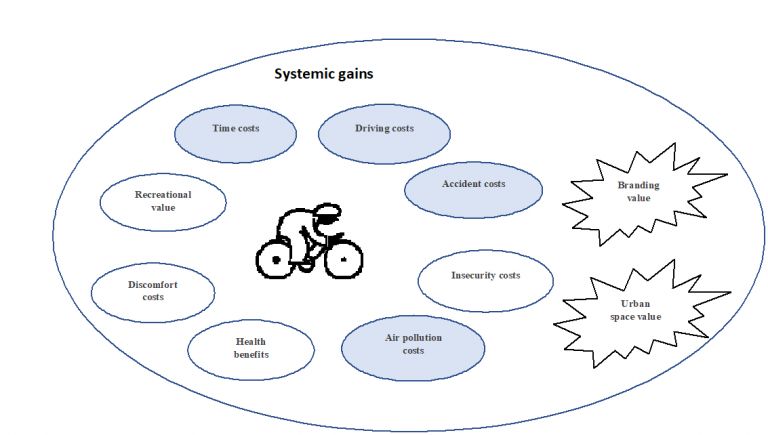
- Figure 1.1: Cost-benefit effects of cycling
Altogether the economic benefit by one kilometre cycled is DKK 4.79 (€ 0,64) when all valuated effects are included. This means that the economic cost of cycling is much lower than the cost of car transport if the car does not contain more than 1 or 2 passengers. Society consequently saves at least DKK 10 per kilometre (€ 1,34) when people cycle rather than drive (DKK 4.79) per kilometre cycled (€ 0,64) deducted from DKK -5.29 per kilometre driven by car (€ 0,71)). Switching from car trips to cycle trips is thus an excellent investment. And the benefits are even better for some places. For instance, it’s assumed that cars drive at 50 k/h in cities. However, in many larger cities cars will drive at a much lower speed during peak hours. Add to that the time it takes to find a parking place and the walking distance, and it becomes even more profitable to invest in cycling promotion.
Internal Interest Rate
The internal interest rate is a measure of the annual cost-benefit return on an investment. In order for a project to be socio-economically profitable its internal rate of return should be compared to an alternative rate of return of 4% (Danish Ministry of Transport, 2015).
Examples of infrastructure projects and their calculated internal rate of return:
Project IRR (%) Construction costs (DKK billion) Cycle Superhighways in the Danish Capital Region 11 2 Central Jutland motorway corridor 7.5 19 Railway electrification (Train Fund DK) 5.5 10 Harbour Tunnel (new Eastern ring road in Copenhagen)
4 20 Source: Ministry of Transport, 2015, Analyse Kraka 2018, Incentive 2018
CASES
Three cases have been selected to illustrate different examples for calculations of economics. The first example is a strategic analysis that studies the overall benefits of cycling promotion. The second example is an economic analysis of a cohesive cycle route, the Cycling Superhighways in the Danish Capital Region. The third example is an economic analysis of the bicycle bridge, the Cycle Serpent, (Cykelslangen) in Copenhagen in 2014.
The overall cost-benefit of increased cycling
The Confederation of Danish Industry and Incentive ran a scenario study of two different scenarios: either more or less cycling in the capital region of Denmark. Four traffic models were run, two scenarios where bicycle traffic in the capital region drops by 67% and 33% respectively, and two scenarios where bicycle traffic rises by 22% and 35% respectively.
The estimated connection between cycling and congestion in the capital region can be seen in Figure 1. This shows that there is no linear connection between changes in the volume of cycling and congestion in the capital region. An increase in the number of bicycle trips will therefore not reduce congestion to the same degree that an equivalent decrease in the number of bicycle trips will increase it. This is due to the fact that when the roads have just about reached their maximum capacity limit, a cyclist who switches to a car will increase congestion more than a driver who switches to the bicycle will reduce it.
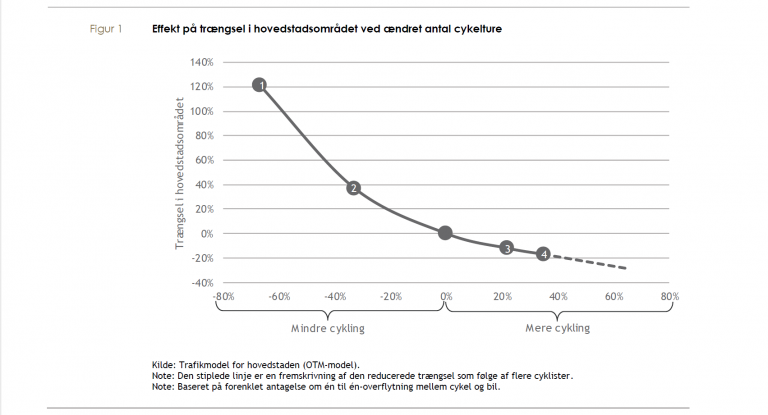
- Figure 4: The four scenario calculations


The analysis shows that if 10% more kilometers are cycled there will be an annual socio-economic gain in Denmark of DKK 1.1 billion (€ 150 mil.). In the capital region the annual gain will be approx. DKK 0.5 billion (€ 70 mil.). For purposes of comparison the Danish regional health authorities spend approx. DKK 15.3 billion (€ 2 billion) annually on general doctor-practices.
Cost-Benefit Analysis of the cycle superhighways
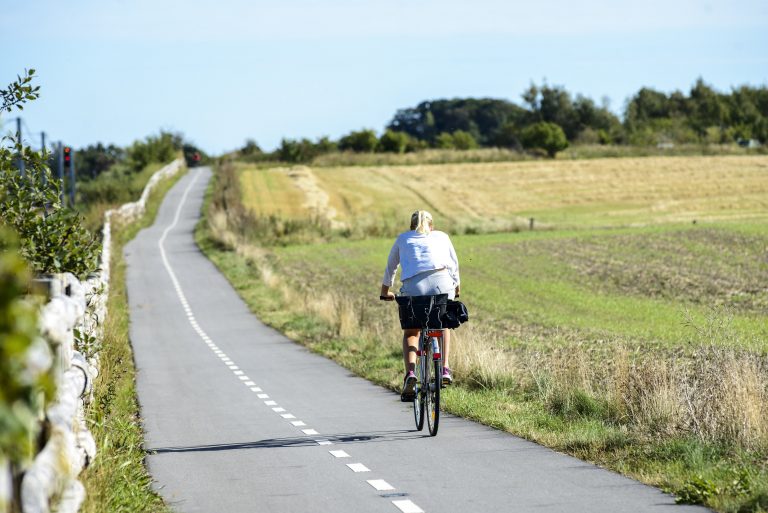
- Picture of the Cycle Superhighway, Frederikssund Route, Credit: Cycle Superhighways, Capital Region of Denmark
The total 750 km network of cycle superhighways in the capital region of Denmark involves an estimated investment of more than DKK 2.2 billion (€ 29 mil.). An economic analysis shows that the route network taken as a total investment has an internal interest rate of 11% and a cost-benefit gain of DKK 5.7 billion (€ 76 mil.). By comparison the Metro City ring has an internal interest rate of 3%, the Femern tunnel 5.4%, and the Herning-Holstebro motorway 8.2%. Cycle Superhighways ranks among the top five most profitable projects in a survey of all economic analyses of Danish infrastructure projects.
When the benefits are distributed over State, regional and municipalities it becomes clear that construction costs are not placed where the benefits are gained. It is primarily the State that benefits from the saving on health costs while the municipalities benefit from savings on construction and operations. This means that in the three scenarios where the State pays 0%, 50%, and 100% respectively, it is always the State that reaps most of the benefits since the local authorities must bear greater costs of maintenance and operations.
The route network is spread over the entire region and consequently construction costs and estimated potential vary accordingly. This means that if the route network is ranked correspondingly then the interest rate of certain cycle superhighways is significantly higher than others. This is primarily due to the fact that benefits are mostly generated by existing cyclists, which means that areas with a previously low bicycle share will have significantly lower benefits.
Table 7: Corridors’ internal interest rate
| Corridor | Internal Interest |
| Inner City, finger corridor | 37 % |
| Inner City, ring connection | 24 % |
| Finger corridors | 15 % |
| Ring connections | 10 % |
| Routes in open country | -3 % |
| Average | 11 % |
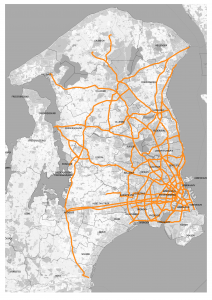
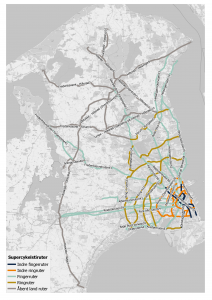
Map of cycle superhighways. Source. Cycle Superhighways, Capital region of Denmark:
The Bicycle Snake
The Bicycle Snake (Cykelslangen) is a 235-meter bicycle bridge connecting Islands Brygge Bridge with Dybbølsbro and Vesterbro. It was completed in 2014. It cost DKK 31.5 million (€ 4,2 mil.), but an economic analysis shows that the bridge has a total benefit of DKK 44 million (€ 5,9 mil.), and an internal interest rate of 9% over a 20-year calculation period. A large part of the total gain is due to time saved and increased experienced accessibility for existing cyclists. Since cyclists save some kilometres cause of the bridge there is an increase of health costs for the individual and for the society. Other gains include new cycle trips and new switched trips from cars and public transport.
Cost-benefit of walking
In 2018 did the consulting house Realise drew up a proposal on the initiative of the City of Copenhagen for unit prices for walking. This is the first time an economic analysis of walking was developed in Denmark. Walking requires more energy than cycling, so the health effect is greater. In terms of the total effects at the person level there is a higher cost when a person walks one kilometre due to the increased cost of time. But on a societal level the health benefits derived from walking makes it the most profitable transport mode from a cost-benefit point of view, with a societal gain of DKK 7.4 per kilometre walked (€ 1).
Conclusion
Hopefully economic analyses of cycling and walking projects will become higher prioritized and have a greater significance for infrastructure investments, and hopefully the future will bring more knowledge of the effects of cycling and walking projects and thereby improve the accuracy of their evaluation. This would strengthen the political cycling agenda locally in the municipalities as well as the State level and create a basis for prioritizing cycling infrastructure projects on equal terms as other infrastructure projects. In addition, the economic analyses can illustrate the broader effects of bicycle traffic. The health authorities could for instance become more involved in bicycle traffic since greater bicycle traffic can be used as a preventive health measure.
The bicycle industry’s economic contribution
A high bicycle share in cycling cities such as Copenhagen and Amsterdam are not only beneficial from a socio-economic point of view. Another beneficial effect of the cities’ good cycling condition is the turnover and the jobs created by enterprises that sell and produce bicycles. Danish and Dutch studies show the direct economic impact of the bicycle industry.
| Copenhagen | Amsterdam | |
| Bicycle Enterprises | 309 | 300 |
| Jobs in bicycle enterprises | 650 | 900 |
| Annual turnover | 170 mil. euro | 100 mio. euro |
A non-car producing economy
Holland and Denmark are non-car-producing countries. Holland has carried out studies to determine what this means for the economy. In Holland consumption of cars and fuel are not necessarily economic gains. Cars and oil are import commodities in Holland, which means that financing and subsequent employment does not take place in Holland. Cycling on the other hand requires neither imported cars nor imported fuel. Holland annually produces more than 400,000 bicycles.
The study shows:
- For every Euro spent on fuel, only 4% remains in the local economy
- For every Euro a cyclist spends, 32% remains in the local economy
Cycling infrastructure investments
Studies show that Holland is the country in the world that invests most heavily in cycling infrastructure. (Danish figures for 2009 and Dutch figures for 2010). However, distribution among the different transport modes still varies when it comes to the number of inhabitants and the number of kilometers cycled.
| Annual investments in different transport modes in Holland (2009) | Annual investment per person | Annual investment per km cycled |
| DKK (€) | DKK (€) | |
| Bicycle | 250.00 kr. (€ 33) | 0.22 kr. (€ 0,03) |
| Car | 2,550.00 kr. (€ 342) | 0.75 kr. (€ 0,10) |
| Bus | 200.00 kr. (€ 26) | 1.00 kr. (€ 0,14) |
| Train | 1,000.00 kr. (€ 133) | 1.34 kr. (€ 0,18) |
Sources
Manual for samfundsøkonomisk analyse på transportområdet, Transportministeriet, 2015
COWI 2009, Samfundsøkonomiske analyser af cykeltiltag – metode og cases
Realise 2018: Samfundsøkonomisk nøgletalsanalyse for fodgængertrafik i København
DTU 2018: Transportøkonomiske Enhedpriser
COWI 2009, Samfundsøkonomiske analyser af cykeltiltag – metode og cases
Incentive 2018: Effekter af øget cykling
Incentive 2018: Samfundsøkonomisk analyse af supercykelstierne
Analyse Kraka 2018: Danske investeringer i infrastruktur kan og bør prioriteres bedre
COWI 2017: Samfundsøkonomisk analyse af cykelslangen
Københavns Kommune 2010: Cykelregnskab 2010
Decisio 2017: Bikenomics Amsterdam, Infographic en achtergronden
Decisio 2017: Bruto Utrechts Fietsproduct (Utrecht gross cycling product)
Decisio 2017: Maatschappelijke Waarde en Investeringsagenda Fietsen, Verantwoordingsrapportage


